At the recent Joint Techs conference, our host Stanford University arranged a lunch time tour of the Stanford Linear Accelerator Center (SLAC) for a small group of attendees. I signed up early as I knew it was going to popular with this crowd. SLAC is a 50 GeV electron-positron accelerator operated by Stanford on behalf of the US Dept of Energy.
(SLAC is now officially known as the "SLAC National Accelerator Lab".)
This is the second particle accelerator site I've visited. In the summer of 2007 (also during a Joint Techs conference), I saw Fermilab and the 2 TeV Tevatron, at that time the world's most powerful particle accelerator. My annotated photos from that visit are on flickr. The Tevatron ceased operation in late 2011. One of these days, I hope to visit the Large Hadron Collider at CERN.
Here are some photos from the SLAC tour. The full set is also available.
Bebo White, a noted SLAC computational physicist, was our tour guide. He's an entertaining and jolly character, who by his own admission looks like Santa Claus :-)

How the LINAC works:

Hmm, Science has a long way to go!

SLAC had the first website in North America (the first in the world of course was at CERN, where Tim Berners-Lee worked). Seeing a NeXT Cube brings back memories. That was my main computer for most of my undergraduate years at Penn, when I worked for NeXT as a campus consultant.

Mock-up of accelerator components just outside the end of the Klystron gallery:


Facilities photo/map:

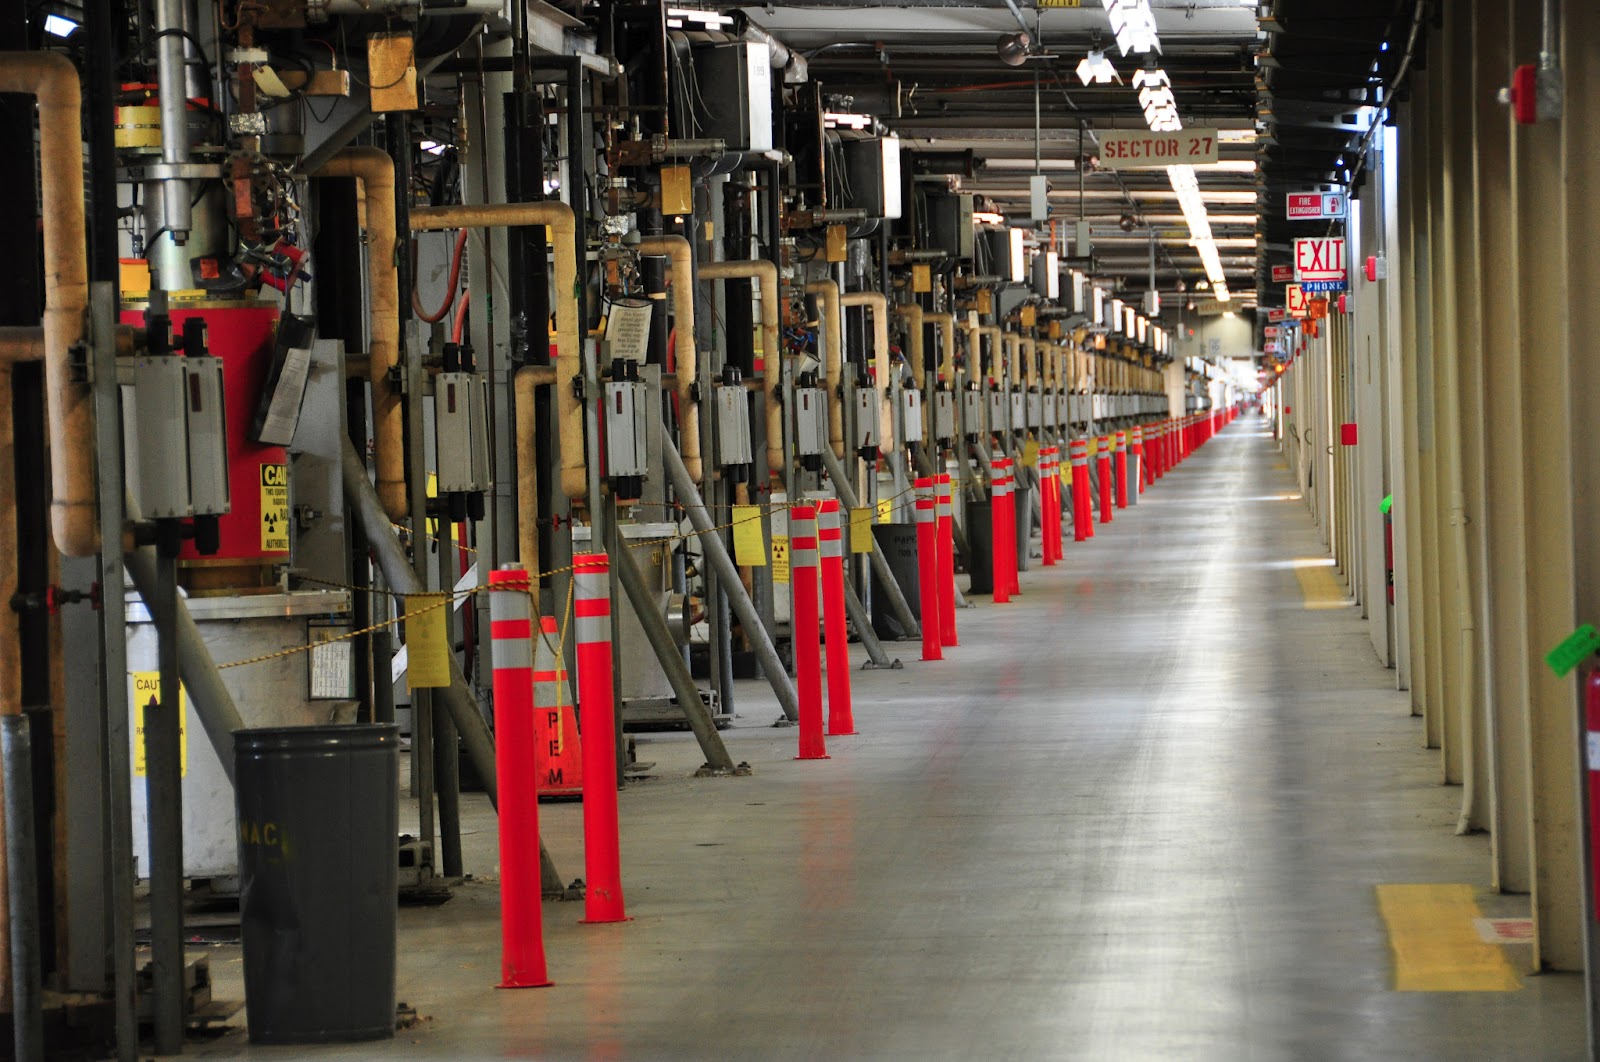
The Klystron gallery along the nearly 2-mile long building that houses the main linac. Klystrons are the key driving force for the accelerator and produce amplified electromagnetic carrier waves that help boost the electrons along the beam line. The Klystrons are to the left of this photo, and sit above the main accelerator beam line which is situated 25-feet beneath the ground. There are 240 Klystrons in total. The particles are injected at the other end of this tunnel.


Our merry tour group ...

(SLAC is now officially known as the "SLAC National Accelerator Lab".)
This is the second particle accelerator site I've visited. In the summer of 2007 (also during a Joint Techs conference), I saw Fermilab and the 2 TeV Tevatron, at that time the world's most powerful particle accelerator. My annotated photos from that visit are on flickr. The Tevatron ceased operation in late 2011. One of these days, I hope to visit the Large Hadron Collider at CERN.
Here are some photos from the SLAC tour. The full set is also available.
Bebo White, a noted SLAC computational physicist, was our tour guide. He's an entertaining and jolly character, who by his own admission looks like Santa Claus :-)

How the LINAC works:

Hmm, Science has a long way to go!

SLAC had the first website in North America (the first in the world of course was at CERN, where Tim Berners-Lee worked). Seeing a NeXT Cube brings back memories. That was my main computer for most of my undergraduate years at Penn, when I worked for NeXT as a campus consultant.

Mock-up of accelerator components just outside the end of the Klystron gallery:


Facilities photo/map:

The Klystron gallery along the nearly 2-mile long building that houses the main linac. Klystrons are the key driving force for the accelerator and produce amplified electromagnetic carrier waves that help boost the electrons along the beam line. The Klystrons are to the left of this photo, and sit above the main accelerator beam line which is situated 25-feet beneath the ground. There are 240 Klystrons in total. The particles are injected at the other end of this tunnel.

Our merry tour group ...


